Report can be accessed by clicking the Report heading on top of the ARitize 3D portal.

Figure 42. The figure showing the location of the Report heading.
Report Filter
Statistical data can be filtered by month or by custom date range. If you want to choose to filter by month, you can click the dropdown Date to choose the month you want. If you want to customize by the data range, activate the Custom Date Range toggle switch to select a period that you want. When you are done with selecting a period, click the FILTER button to update data for the dashboard. You can also create a report as a reference by clicking the CREATE FILE button.
![]()
Figure 43. The image describing the Report Filter features.
Dashboard
Dashboard shows the statistical data of your models in a period of your choice. The dashboard includes the number of model loads, the top 20 models loaded, and the category breakdown based on the given period.
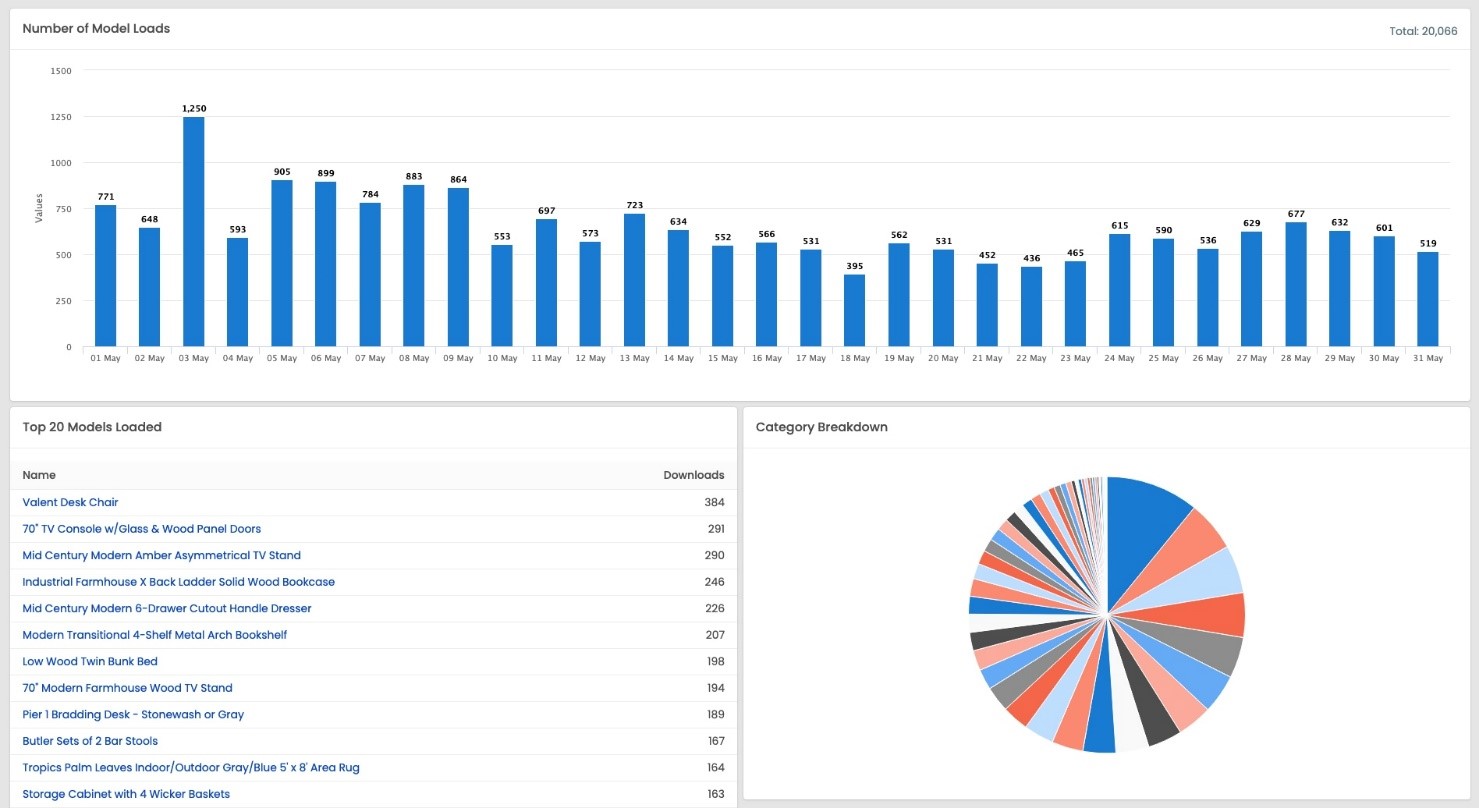
Figure 44. The picture illustrating the outlook of graphs and charts included in the Dashboard.